I’ve received many questions about what the kids’ IGE numbers have been since they began oral immunotherapy. I was definitely curious when I was researching OIT and I like to see numbers too, so I’ve posted them below. Basically, the numbers trend downwards since OIT. Unfortunately, the numbers were already down from their peak before they began OIT (2019), so I won’t ever know if the continued downward trend is due to OIT or if they were on their way to becoming less allergic anyway. Below I list the raw data, and then graphed. I don’t have 2022 numbers, so check back after this summer for those.
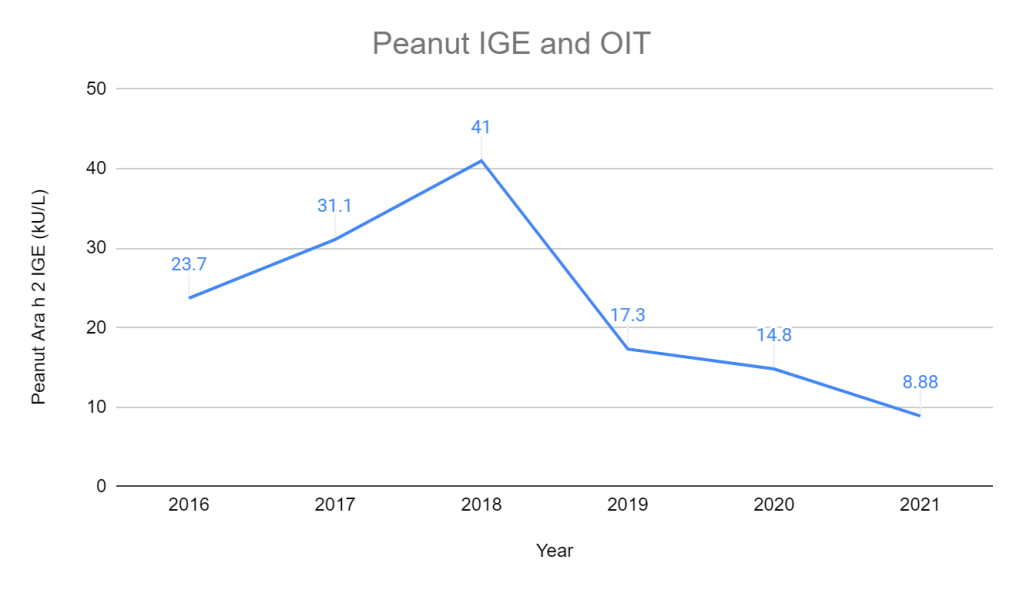
Peanuts and IGE
| Year | Total IGE (IU/mL) | Peanut IGE (kU/L) | Ara h 2 IGE (kU/L) | F447-IGE Ara 6 IGE (kU/L) |
| 2021 | 358 | 8.35 | 8.88 | 4.51 |
| 2020 | 413 | 17.3 | 14.8 | no data |
| (numbers right before OIT start) 2019 | 279 | 18.7 | 17.3 | no data |
| 2018 | 420 | no data | 41 | no data |
| 2017 | no data | no data | 31.1 | no data |
| 2016 | 89.2 | 11.6 | 23.7 | no data |
| 2015 | 119 | 5.19 | no data | no data |
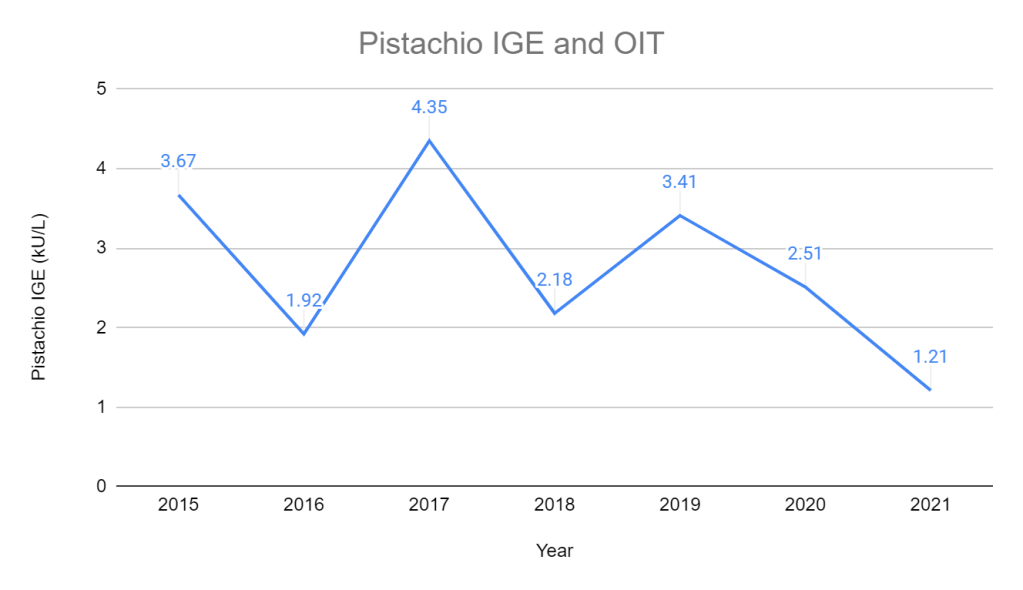
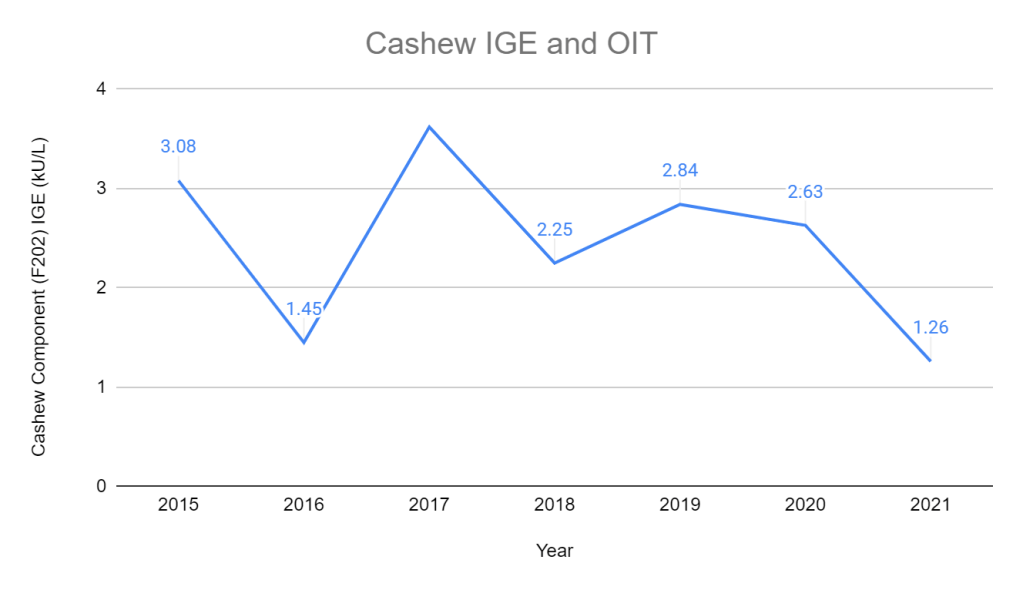
Pistachios, Cashews, and IGE
| Year | Total IGE | Pistachio | Cashew Component (F202) | Cashew Component (F443-IGE Ana o 3) |
| 2021 | 297 | 1.21 | 1.26 | 0.91 |
| 2020 | 448 | 2.51 | 2.63 | 1.85 |
| (numbers right before OIT start) 2019 | 326 | 3.41 | 2.84 | 1.9 |
| 2018 | 365 | 2.18 | 2.25 | 1.56 |
| 2017 | no data | 4.35 | 3.62 | no data |
| 2016 | 268 | 1.92 | 1.45 | no data |
| 2015 | no data | 3.67 | 3.08 | no data |